
How to Look Up New Castle County Jail Population Data
The primary data set for New Castle County inmate population sits with the Delaware DOC. The DOC research and statistics page hosts research briefs and data series. The DOC annual report page hosts the full year-end count, broken out by facility and security level. The reports update on an annual cycle. Interim figures are posted from time to time, but a daily county jail census is not part of the official Delaware data set because the state runs the jails as a unified system.
The DOC research and statistics portal is shown below.
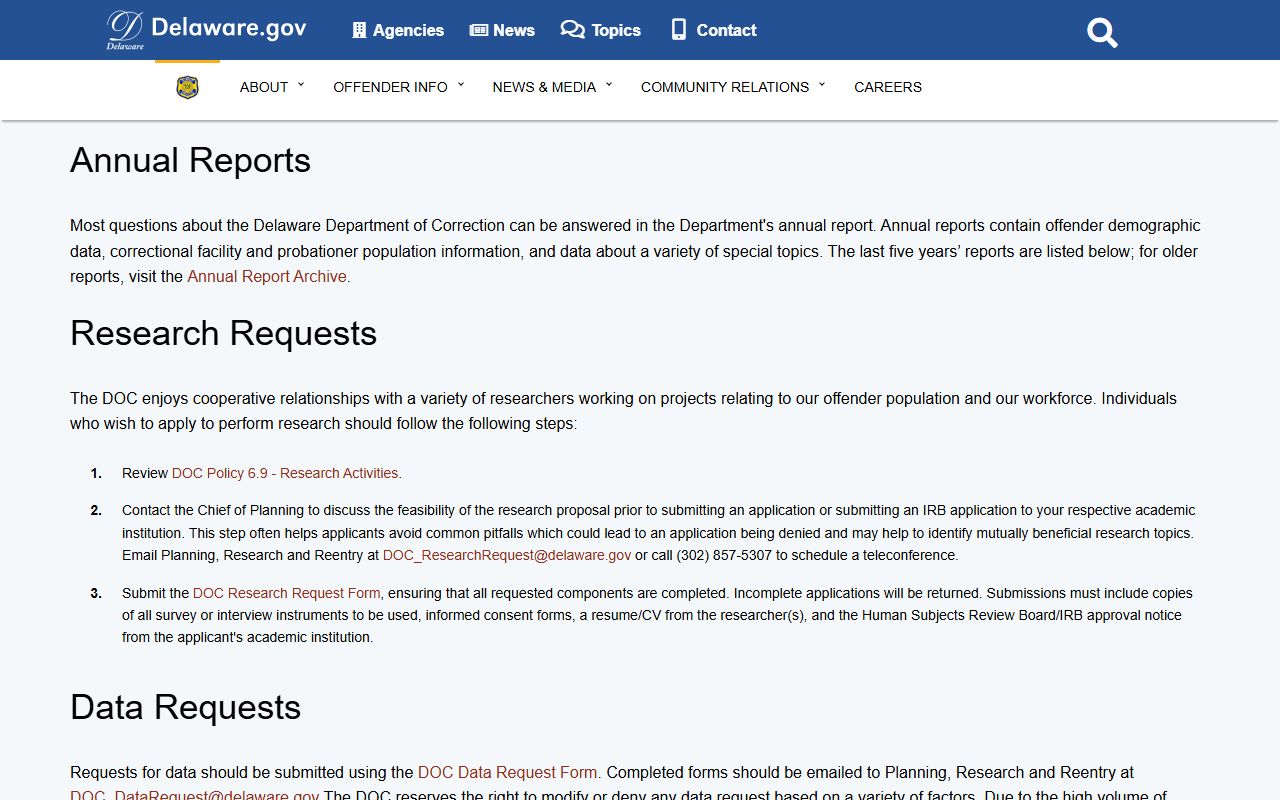
The page hosts briefs and PDFs. Each brief lists the data range, the source, and the date of release. The official data set is the one on this DOC page or the annual report.
For national context, the Bureau of Justice Statistics publishes jail and prison series. Vera publishes a county-level trend tracker. Both fill in where Delaware does not break out county-level numbers. The DOC annual report screen is shown below.
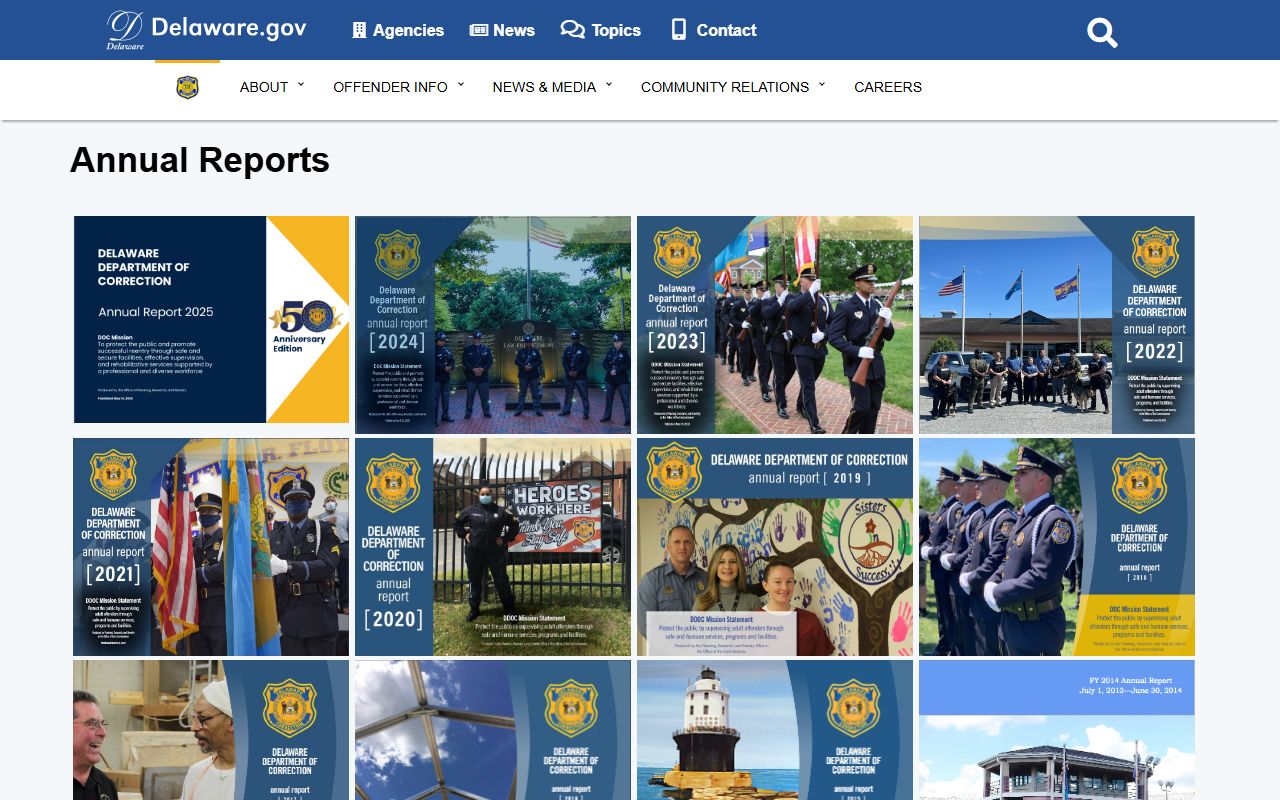
The annual report lists facility-level counts, admissions, releases, sentence levels, and program data. It is the most complete public file on the held population in Delaware.
New Castle County Jail Capacity Overview
Three DOC sites sit in or near New Castle County and hold most county-tied inmates. Howard R. Young Correctional Institution in Wilmington is the main intake and pretrial facility. Baylor Women's Correctional Institution is the state women's site in the New Castle area. Plummer Community Corrections Center in Wilmington is the work release and community custody site. Exact rated capacity figures change with bed expansions, dorm closures, and renovation cycles. The DOC facility page is the source for the current count.
| Facility | County Role | Capacity / Population Source |
|---|---|---|
| Howard R. Young Correctional Institution | Main DOC site in Wilmington for pretrial and sentenced inmates | See current DOC facility page and annual report |
| Baylor Women's Correctional Institution | State women's facility in the New Castle area | See current DOC facility page and annual report |
| Plummer Community Corrections Center | Work release and community custody in Wilmington | See current DOC facility page and annual report |
Bed count is not the same as a hard limit. A facility may run over rated capacity during a spike. A facility may run under capacity during a downturn. The annual report tracks both rated capacity and the average daily count.
Average Daily Population
Average daily population, or ADP, is the standard metric for a jail. It is the mean count of held people across a year. The DOC annual report lists ADP by facility. The Howard R. Young ADP is the closest single figure to a New Castle County jail count. Year-over-year change is the second key metric. A rise points to longer holds or more intake. A drop points to faster releases, fewer arrests, or program diversions.
For a specific ADP figure, the current DOC annual report is the source. Numbers shift year to year, so a single past figure is not a safe stand-in for the present. The trend is more useful than any one year's count.
ADP is one of three core counts. The other two are admissions and releases. Admissions track new bookings in a year. Releases track exits in the same window. Net change is the gap between the two. A flat ADP with high admissions and high releases means a high turn rate. A flat ADP with low admissions means longer holds. Both patterns show in the state report and shape how state and county actors plan beds, staff, and program slots.
Demographic Breakdown
The DOC reports a demographic split for the state held population. The split covers sex, race, ethnicity, and age. New Castle County is the largest source of new state DOC admissions because it is the most populous Delaware county. The split for Howard R. Young is the closest stand-in for the county. The data set is the DOC annual report. Confirm current numbers before citing a percentage.
| Group | Source for Current Percent |
|---|---|
| Sex (male / female) | DOC annual report, facility-level table |
| Race and ethnicity | DOC annual report, statewide and facility tables |
| Age band | DOC annual report, admissions table |
| Security level | DOC annual report, level tables |
| Sentence type | DOC annual report, sentence tables |
National context for race and sex splits sits with BJS. The state share for Black inmates has run above the share in the state population for many years, a pattern that holds nationally too. The DOC report is the source for the current Delaware figure.
Pretrial vs Sentenced Population
The pretrial share is one of the most watched jail metrics. A high pretrial share points to slow case flow or strict bail. A low pretrial share points to quick release or fast disposition. Delaware DOC tracks pretrial and sentenced counts in the annual report. Howard R. Young carries a heavy pretrial share because it is the main intake site for New Castle County.
| Status | Source for Current Percent |
|---|---|
| Pretrial | DOC annual report, facility-level pretrial count |
| Sentenced | DOC annual report, sentenced count by level |
| Hold for another agency | DOC annual report, hold and detainer notes |
People held for another agency, such as a federal hold or out-of-state warrant, are tracked apart from state pretrial and state sentenced. The annual report breaks them out.
Misdemeanor vs Felony Population
Most people held at a Level V DOC site are facing or serving felony cases. Misdemeanor holds tend to be short. A person held on a misdemeanor warrant or a brief sentence may cycle out before showing in a long count. The DOC annual report leans toward sentence-level reporting rather than charge class, so an exact misdemeanor share is hard to pull. For misdemeanor case detail, the court file is the best source. See New Castle County court records for case-level data.
The split also tracks where a case sits in the court system. Felony cases in New Castle County route to Superior Court. Many misdemeanor cases route to the Court of Common Pleas or to Justice of the Peace Court. A person held during a felony case is more likely to wait at Howard R. Young. A person held during a misdemeanor case is more likely to be released quickly on bond or recognizance. For active warrants in either class, see New Castle County warrant records.
Mental Health and Medical Population
DOC tracks the share of held people on the medical and behavioral health caseload. Numbers move with intake patterns and state program changes. The annual report has a section on offender healthcare. A spike in the mental health caseload can flag a need for more treatment beds, a slowdown in diversion programs, or a staffing gap. Note: medical and mental health data is reported in aggregate only; individual records are not public.
The held population also includes people in substance abuse treatment programs. Delaware uses in-custody treatment tracks for some sentenced inmates. The work release setting at Plummer is part of the step-down path for people moving back to the community. The data set on these programs is in the annual report under the program section.
National and State Context
Jail and prison data has national context. The Bureau of Justice Statistics publishes the main federal series. The screen for the BJS portal is shown below.

BJS rate-per-100,000 figures are the standard way to compare a state or county to the national average. Delaware's unified DOC means county-to-county comparison within the state is less clean than in states with sheriff-run jails. Vera at incarcerationtrends.vera.org publishes county-level series where data is available.
| Level | Jail Population per 100k (source) |
|---|---|
| New Castle County | See Vera county series; confirm latest year |
| Delaware | See DOC annual report and BJS state series |
| National | See BJS jail and prison reports |
A side-by-side rate is the cleanest way to spot a county that runs hotter or cooler than the state and national mean.
Population Trends Over Time
Jail and prison populations fell sharply at the start of the COVID-19 era. Courts slowed. Arrests fell. Releases sped up. Counts rose again as courts caught up and arrests rebounded. Delaware tracked the same pattern. The DOC annual report shows the full year-by-year series. Multi-year context, not a single year, is the safe read.
Longer trend drivers include sentencing reform, the opioid case load, the drop in juvenile cases, the spread of treatment courts, and the slow build-out of work release and community custody. Each driver pulls a different lever on the count. For the local court flow that feeds the jail, see New Castle County court records.
Searching for New Castle County Inmate Records by Name
The data on this page is aggregate. It does not cover a single person. For a name-based lookup of the live jail roster, see New Castle County inmate records. The state DOC custody lookup routes through VINELink, which gives custody status by name or DOC number.
Where the Data Comes From
The official Delaware data set sits with the DOC. The DOC research and statistics page hosts briefs. The DOC annual report page hosts the year-end count. The Bureau of Justice Statistics hosts national series for jail and prison rates per 100,000. Vera at incarcerationtrends.vera.org hosts a county-level tracker.
Numbers tied to New Castle County are best read as DOC facility figures, mainly Howard R. Young, plus state context. A pure county census is not part of the Delaware data set because the state runs the system. For people no longer in custody, see released inmates.
Data quality matters. Check the publish date on any brief. Check the data range. Confirm whether a count is a year-end snapshot or a yearly average. Some figures are point-in-time. Others are full-year sums. Mixing the two leads to a false read of the trend. The DOC report sets out the metric for each table. The BJS series uses standard definitions across all states, which makes a state-to-state read clean.